Exploring Grafana Open Source: Best Practices for Effective Monitoring
الجسم
In today’s data-driven world, effective monitoring is crucial for maintaining the health and performance of IT systems. Grafana Open Source has emerged as a powerful tool for visualizing and analyzing metrics, providing a comprehensive solution for monitoring infrastructure and applications. This article explores the best practices for utilizing Grafana Open Source to achieve effective monitoring.
Understanding Grafana Open Source
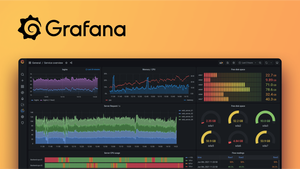
Grafana Open Source is a popular, open source platform for monitoring and observability. It enables users to create dynamic dashboards and visualizations from a wide range of data sources, including databases, logs, and cloud services. By integrating with various data sources like Prometheus, InfluxDB, and Elasticsearch, Grafana provides a unified view of metrics, helping users gain valuable insights into their systems.
Best Practices for Effective Monitoring with Grafana Open Source
-
Define Clear Objectives
Before diving into Grafana Open Source, it is essential to define clear monitoring objectives. Determine what metrics are critical for your environment and what insights you hope to gain. This will help you design relevant dashboards and set up appropriate alerts.
-
Organize Your Dashboards
Effective monitoring hinges on well-organized dashboards. Structure your dashboards to provide a clear overview of system performance, focusing on critical metrics such as CPU usage, memory consumption, and application response times. Use Grafana’s templating features to create reusable dashboards and streamline your monitoring setup.
-
Utilize Panels and Visualizations Wisely
Grafana offers various panel types, including graphs, tables, and heatmaps. Choose the panel type that best represents your data and makes it easy to identify trends and anomalies. For instance, time-series graphs are ideal for tracking changes over time, while tables can be useful for detailed metrics and logs.
-
Implement Alerting
Grafana’s alerting capabilities are a crucial component of effective monitoring. Set up alerts to notify you of potential issues before they escalate. Configure thresholds for metrics and create alerts that trigger notifications through channels like email, Slack, or PagerDuty. Ensure that alerts are actionable and include relevant context to facilitate prompt responses.
-
Optimize Data Sources
The performance of your Grafana dashboards depends on the efficiency of your data sources. Optimize your data sources to ensure fast query execution and reduce load times. Use techniques such as query optimization, indexing, and data aggregation to improve performance.
-
Leverage Annotations
Annotations in Grafana allow you to mark events on your graphs, providing additional context to your visualizations. Use annotations to highlight significant events, such as deployments or outages, and correlate them with performance metrics. This helps in understanding the impact of these events on system performance.
-
Regularly Review and Update Dashboards
As your system evolves, so should your monitoring setup. Regularly review and update your Grafana dashboards to reflect changes in your environment. Remove obsolete panels, add new metrics, and adjust visualizations to keep your monitoring relevant and effective.
-
Security Considerations
Grafana Open Source provides robust security features, including role-based access control and authentication integrations. Implement security best practices to protect your monitoring environment. Restrict access to sensitive data, regularly update Grafana to the latest version, and use strong authentication methods to safeguard your dashboards.
-
Integrate with Other Tools
Enhance your monitoring capabilities by integrating Grafana with other tools and services. For example, combine Grafana with alert management systems, incident response platforms, or log management solutions to create a comprehensive monitoring and response ecosystem.
-
Educate Your Team
Ensure that your team is well-versed in using Grafana Open Source. Provide training and resources to help them understand how to interpret dashboards, configure alerts, and troubleshoot issues. A knowledgeable team can leverage Grafana more effectively and respond to issues promptly.
Conclusion
Grafana Open Source is a versatile and powerful tool for effective monitoring, offering a range of features to visualize and analyze metrics. By following best practices such as defining clear objectives, organizing dashboards, utilizing alerts, and optimizing data sources, you can maximize the benefits of Grafana and ensure a robust monitoring setup. Embrace the power of Grafana Open Source to gain valuable insights into your systems and maintain optimal performance.


تعليقات